Site Targeting was on the short list for the 2014 Scrip Award for Best Technological Development in Clinical Trials.
The Client
Quintiles (now IQVIA), is an American multinational company serving the combined industries of health information technologies and clinical research. It is one of the world's largest contract research organizations.
The Problem
While Quintiles had unparalleled access to data and resources in the clinical research field, they did not have an effective way of operationalizing that towards certain analytical tasks. The data was siloed and complex, and the existing tools to work with that data were limited and one-dimensional. Quintiles needed a platform that could harness the power behind patient and provider data in a scientifically rigorous yet user friendly way to perform analytics that could augment research efficacy and timelines. The task fell upon me and a team of developers, data scientists and designers to tackle this challenge.
Users and Audience
The users of the new tool would be clinical operations teams who would create logistical maps for where a study could be carried out, determine how many patients currently on file could be enrolled, and if a study of a desired magnitude and profile could be carried out at all.
Team & Role
The primary design challenge was creating a way for the user to build complex data queries. A .NET platform was chosen to ensure that while extremely complex in its interactions and computations, the solution could be user-friendly, visually appealing and efficient.
Having had previous experience designing .NET apps, I led a core team of 3 designers, with constant interaction with internal developers in a fast-paced agile environment.
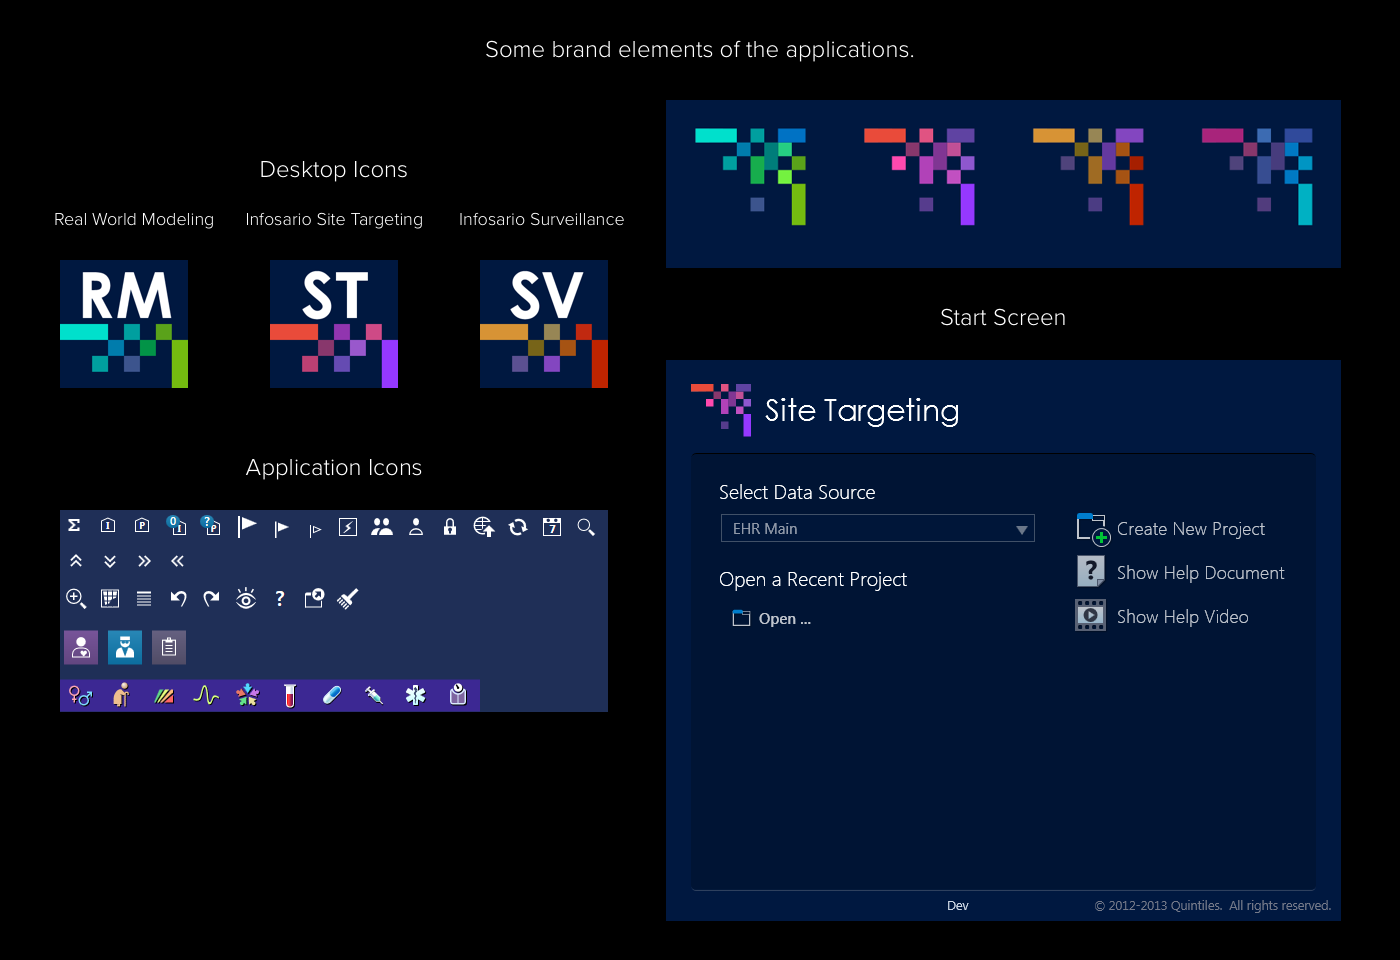
As a design lead on the project, I oversaw all facets of design including user task flows, interaction, and prototyping and was responsible for creating a visual identity and XAML-based design system for the suite of Vantage products.
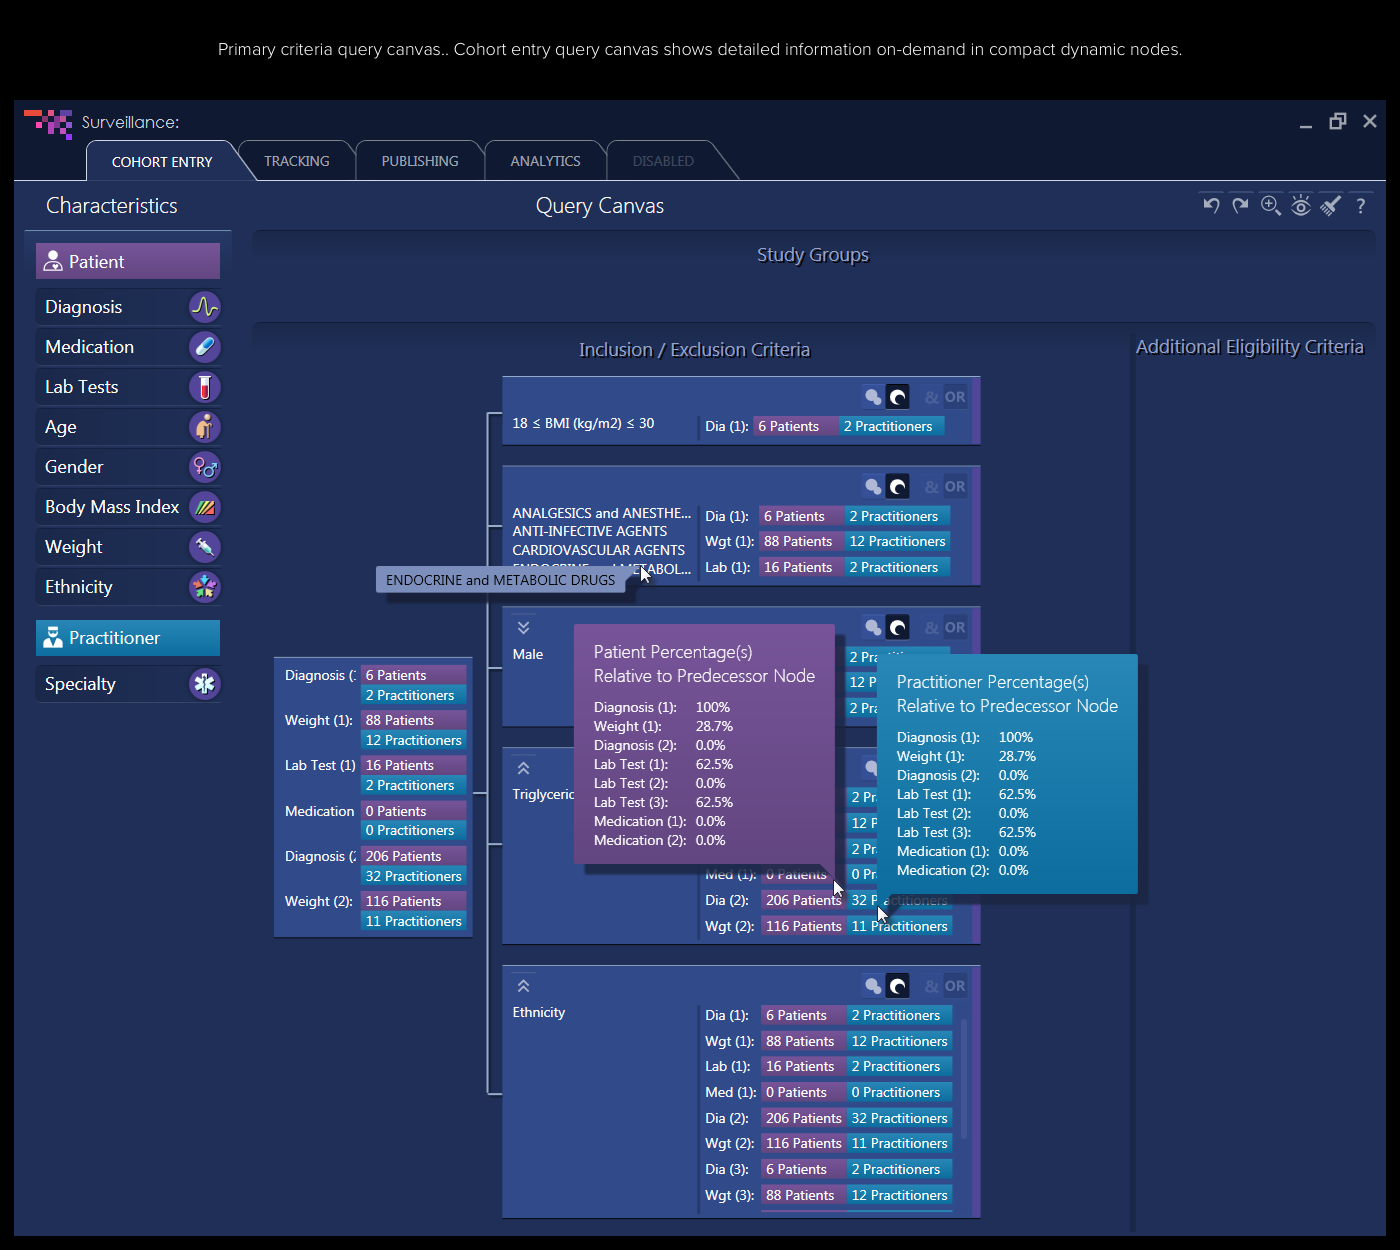
Samples of high-fidelity wireframes
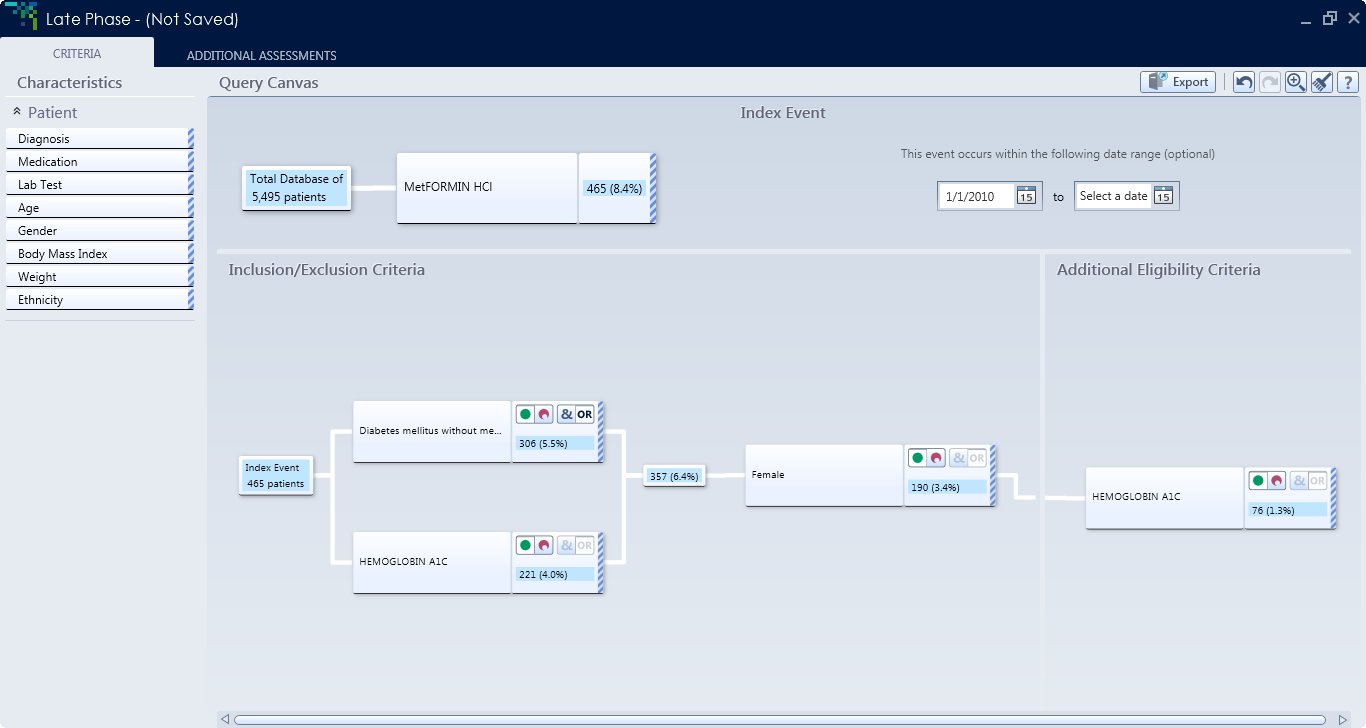
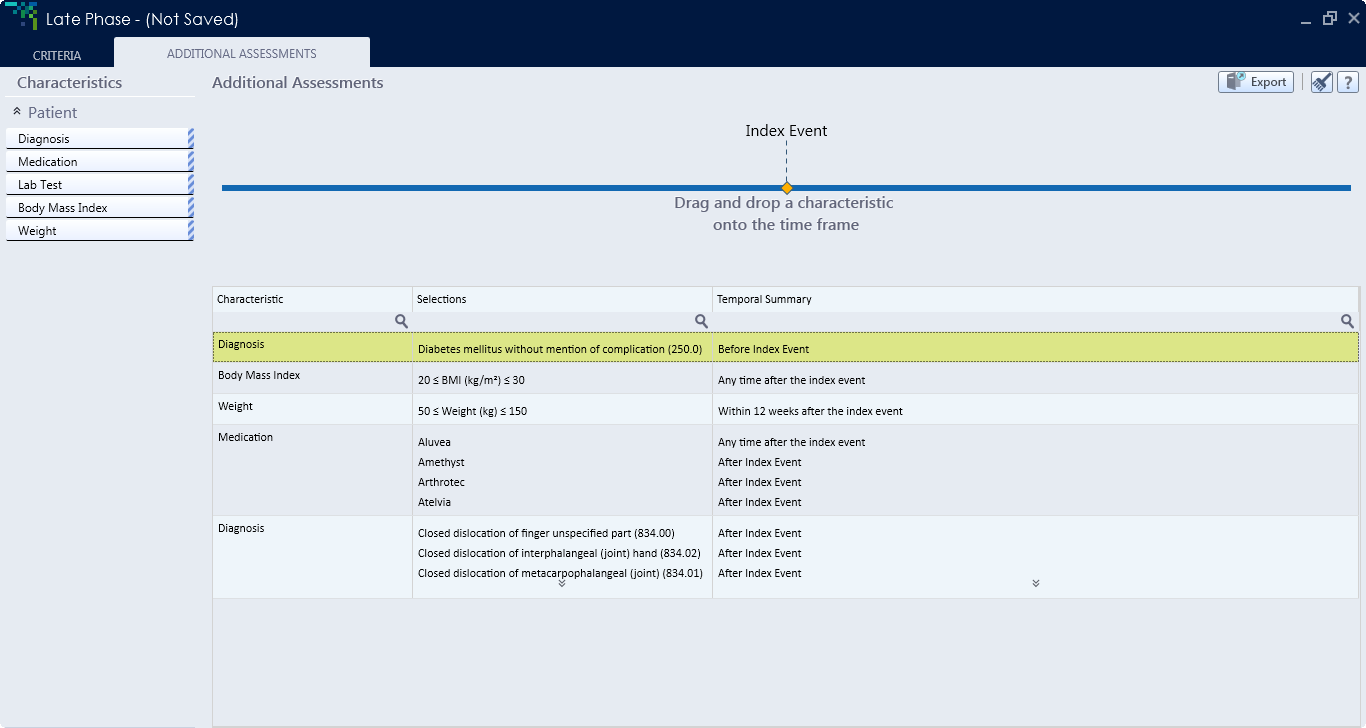
User Interface Design
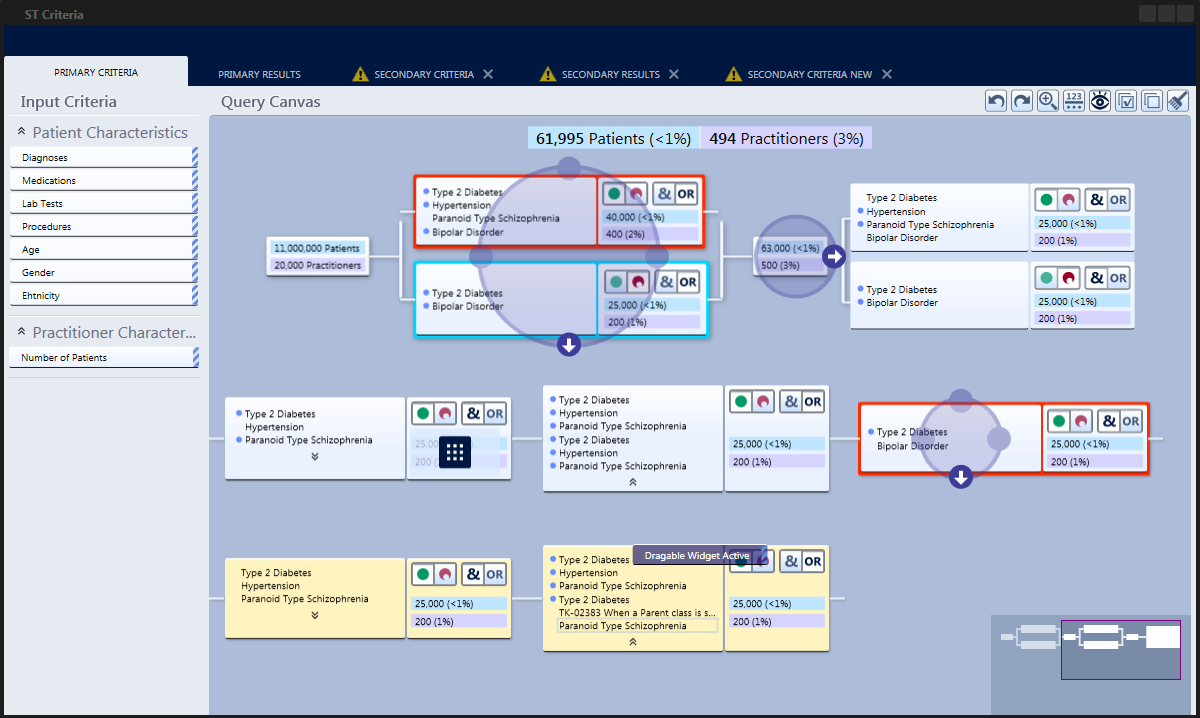
A canvas was created as the centerpiece of the app, where a user could drag and drop data elements, modify them and connect them to other elements in the canvas to create logical queries that would comb through the data and return desired results. The canvas functioned in way that provided the user with immediate feedback of their actions and was easy to modify. This was accomplished by creating a robust drag-and-drop engine, a simple yet effective design, and giving the user constant cues as to the expected result of their actions.
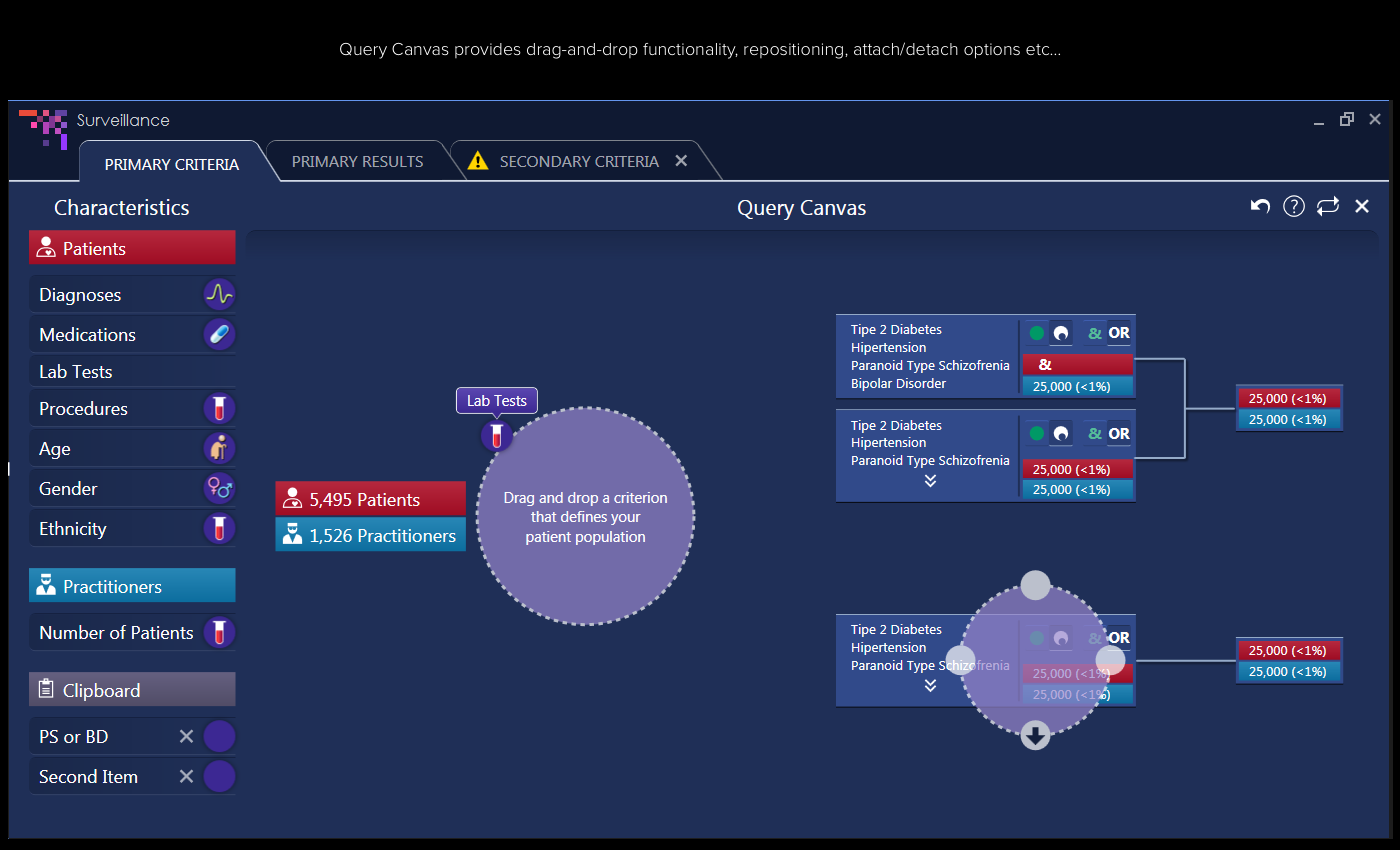


Samples of animated mockups